[MATLAB Toolbox] High quality fiber tract 3D visualization
This MATLAB toolbox for high quality 3D fiber tract visualization constructs 3D visualizations of fiber tract bundles (.trk format) with the following advantages:
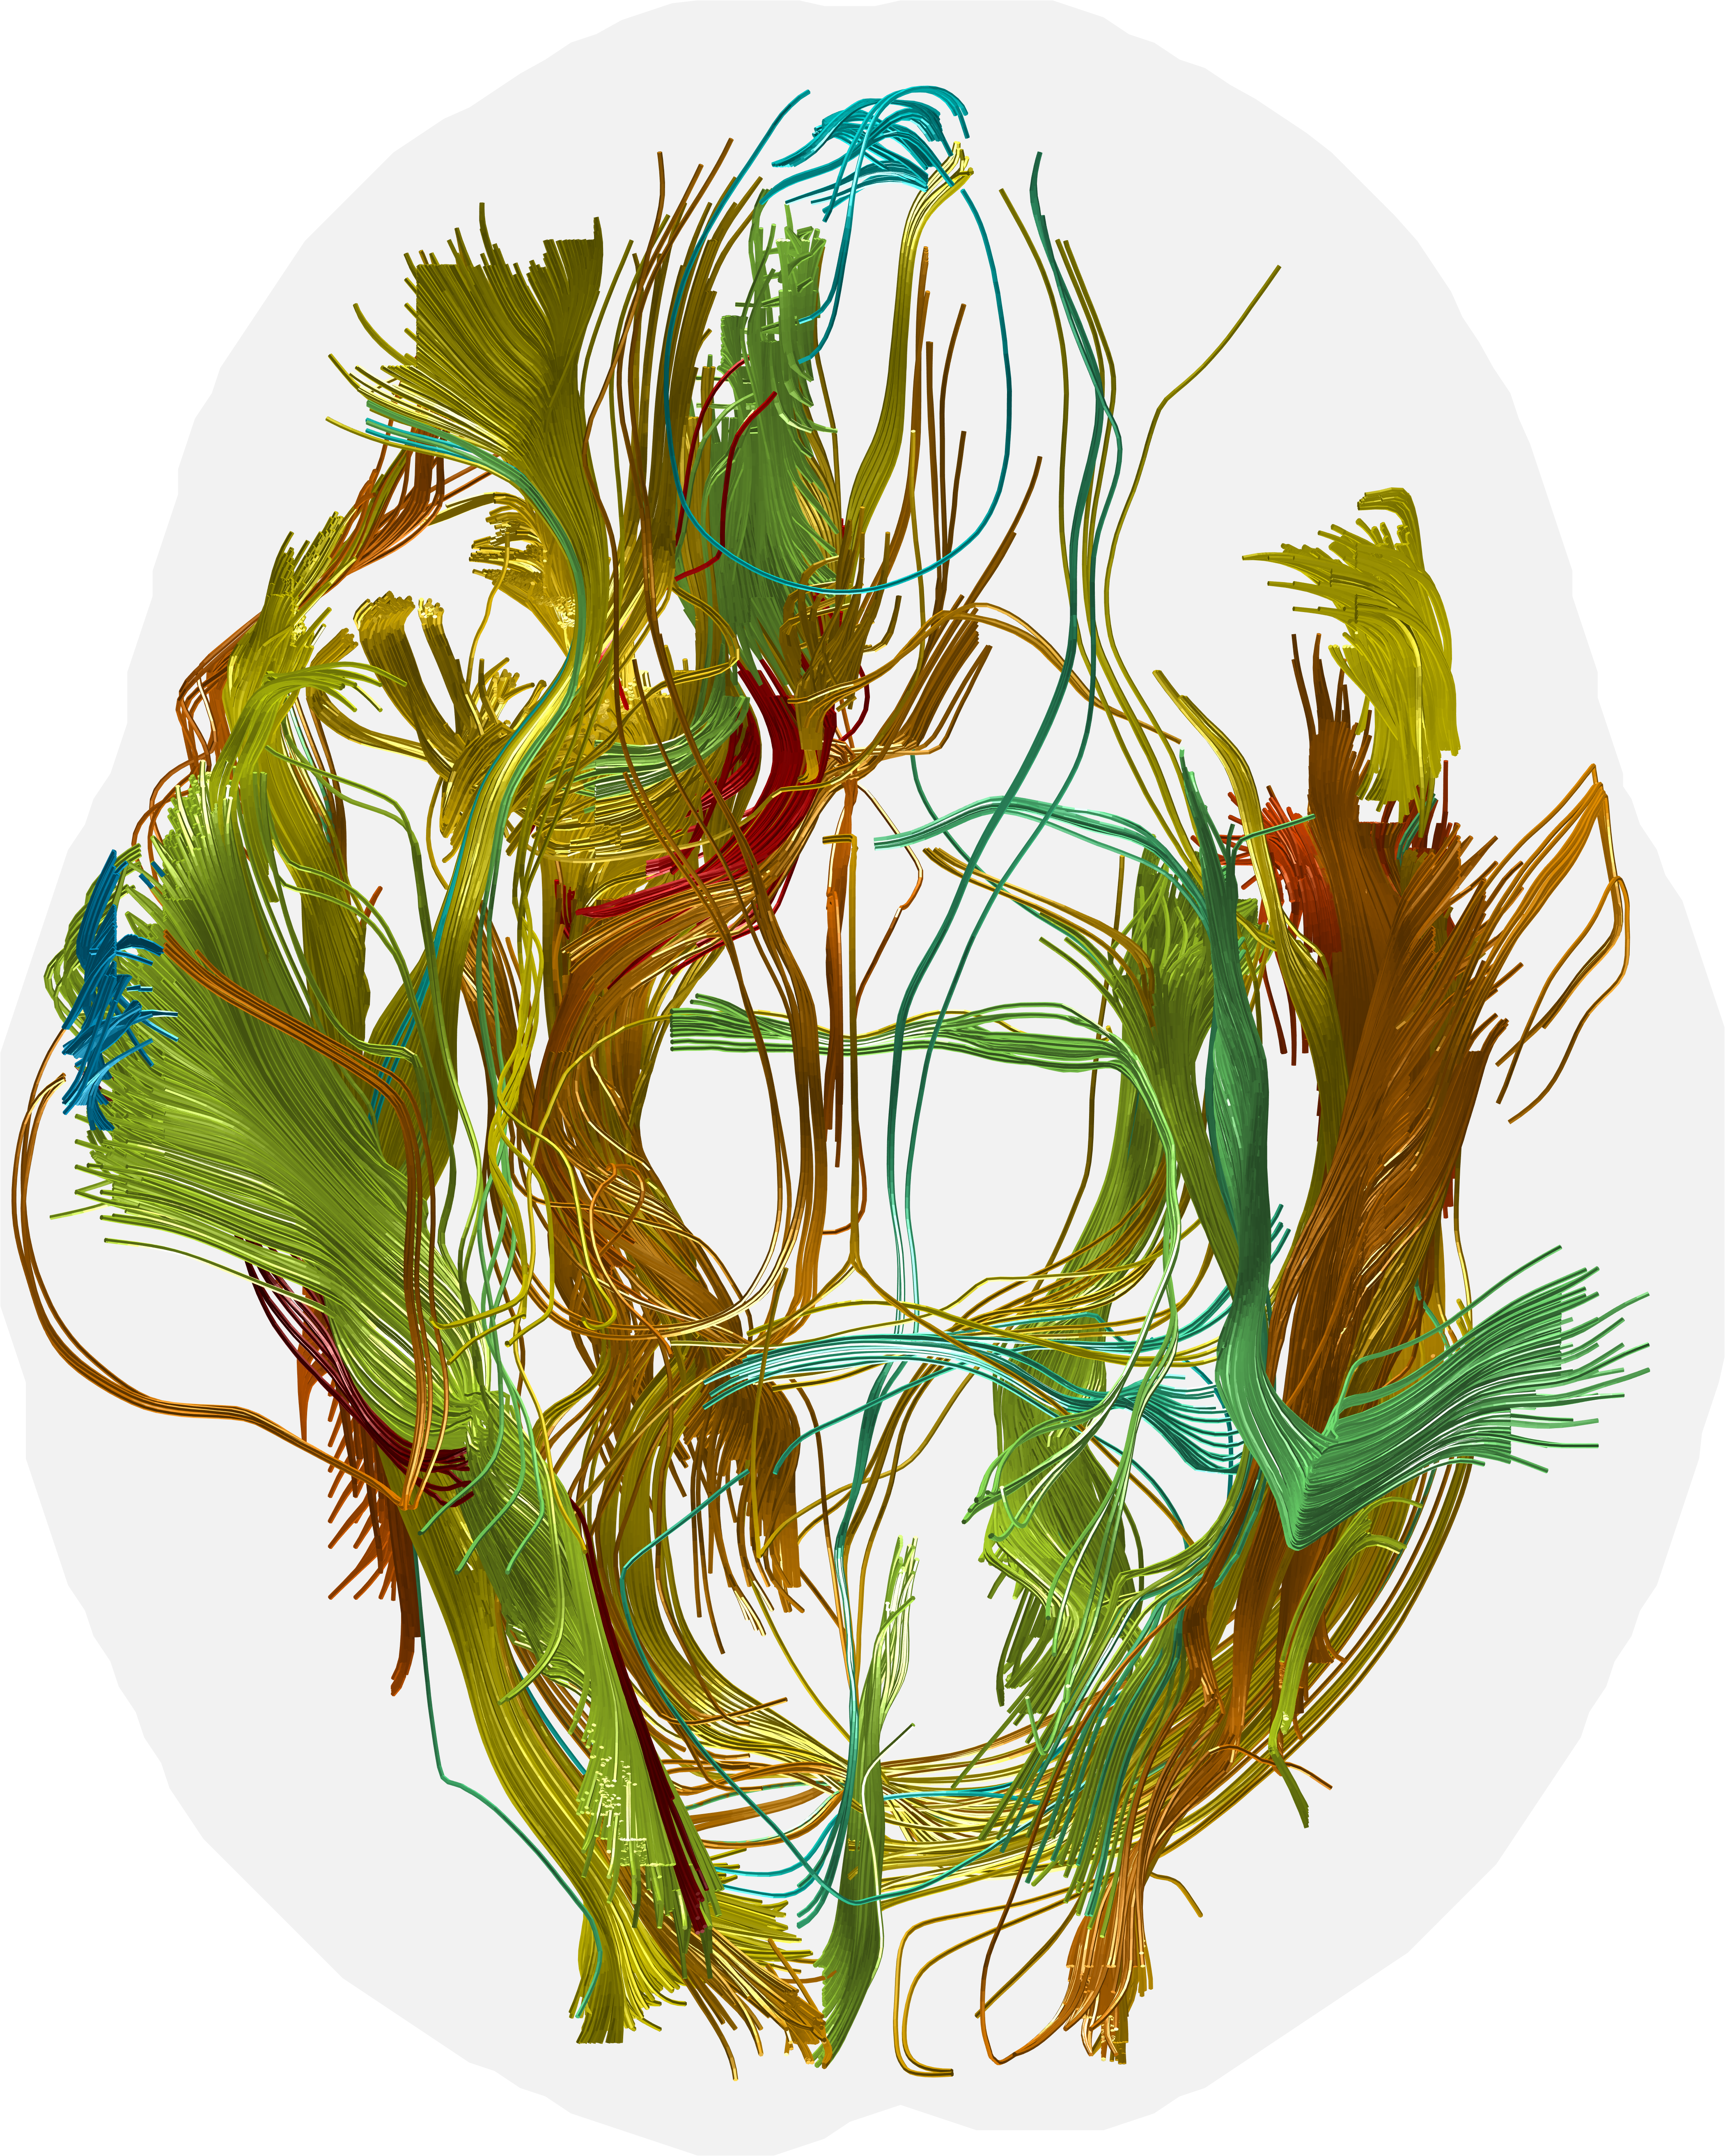
(1) Extremely high resolution and fine rendering (4202 x 5252 size example) of the fiber tracts comparable to TrackVis.
(2) Individually control the tract bundle colors to reflect the associated signals (i.e., connectivity strengths) of your choice.
(3) Simple to use on MATLAB (no mex file, no setup): purely based on the basic functions in MATLAB and high quality print toolbox
export_fig by Oliver J. Woodford and Yair M. Altman.
(4) Video output (gif, avi, mp4): create video animations of a series of outputs to visualize the change of fiber tracts over time.
 Figure: The evolution of top 50 most changing fiber tracts of the real data derived from the coupled harmonic bases. The tract colors represent their strong (blue) and
weak (red) connectivity strengths. Cross-sectional coupling (red arrows) via l-norm in each row. Longitudinal coupling (blue arrows) via rotation constraints in each column.
[Download from GitHub]
Demonstrated publications:
[1] Seong Jae Hwang, Nagesh Adluru, Maxwell D. Collins, Sathya N. Ravi, Barbara B. Bendlin, Sterling C. Johnson, Vikas Singh,
"Coupled Harmonic Bases for Longitudinal Characterization of Brain Networks",
Computer Vision and Pattern Recognition (CVPR), 2016.
[pdf]
[supplementary]
[poster]
[code will be available here]
Figure: The evolution of top 50 most changing fiber tracts of the real data derived from the coupled harmonic bases. The tract colors represent their strong (blue) and
weak (red) connectivity strengths. Cross-sectional coupling (red arrows) via l-norm in each row. Longitudinal coupling (blue arrows) via rotation constraints in each column.
[Download from GitHub]
Demonstrated publications:
[1] Seong Jae Hwang, Nagesh Adluru, Maxwell D. Collins, Sathya N. Ravi, Barbara B. Bendlin, Sterling C. Johnson, Vikas Singh,
"Coupled Harmonic Bases for Longitudinal Characterization of Brain Networks",
Computer Vision and Pattern Recognition (CVPR), 2016.
[pdf]
[supplementary]
[poster]
[code will be available here]